The international group of researchers from the Sloan Digital Sky Survey (SDSS) today publishes a comprehensive analysis of the largest three-dimensional map of the Universe ever created, filling in the most significant gaps in our exploration of the cosmos’ history.
Our knowledge of the Universe includes both its ancient history and the recent history of its expansion. We know how the Universe was like during its infancy thanks to the study of the electromagnetic radiation known as the cosmic microwave background (CMB) and the measurements of the relative amounts of the elements created shortly after the Big Bang. We also know the history of the Universe’s recent expansion, thanks to the maps of galaxies and the distances between them.
However, there were several information gaps between both periods, that extended during 11,000 million years. For the past five years, the SDSS scientists have jointed efforts to find out what happened, and have used that information to achieve one of the most important advances in cosmology in the past decade. At the core of the new results are detailed measurements of more than two million galaxies and quasars, spanning 11 billion years of cosmic time.
The most comprehensive map of the Universe
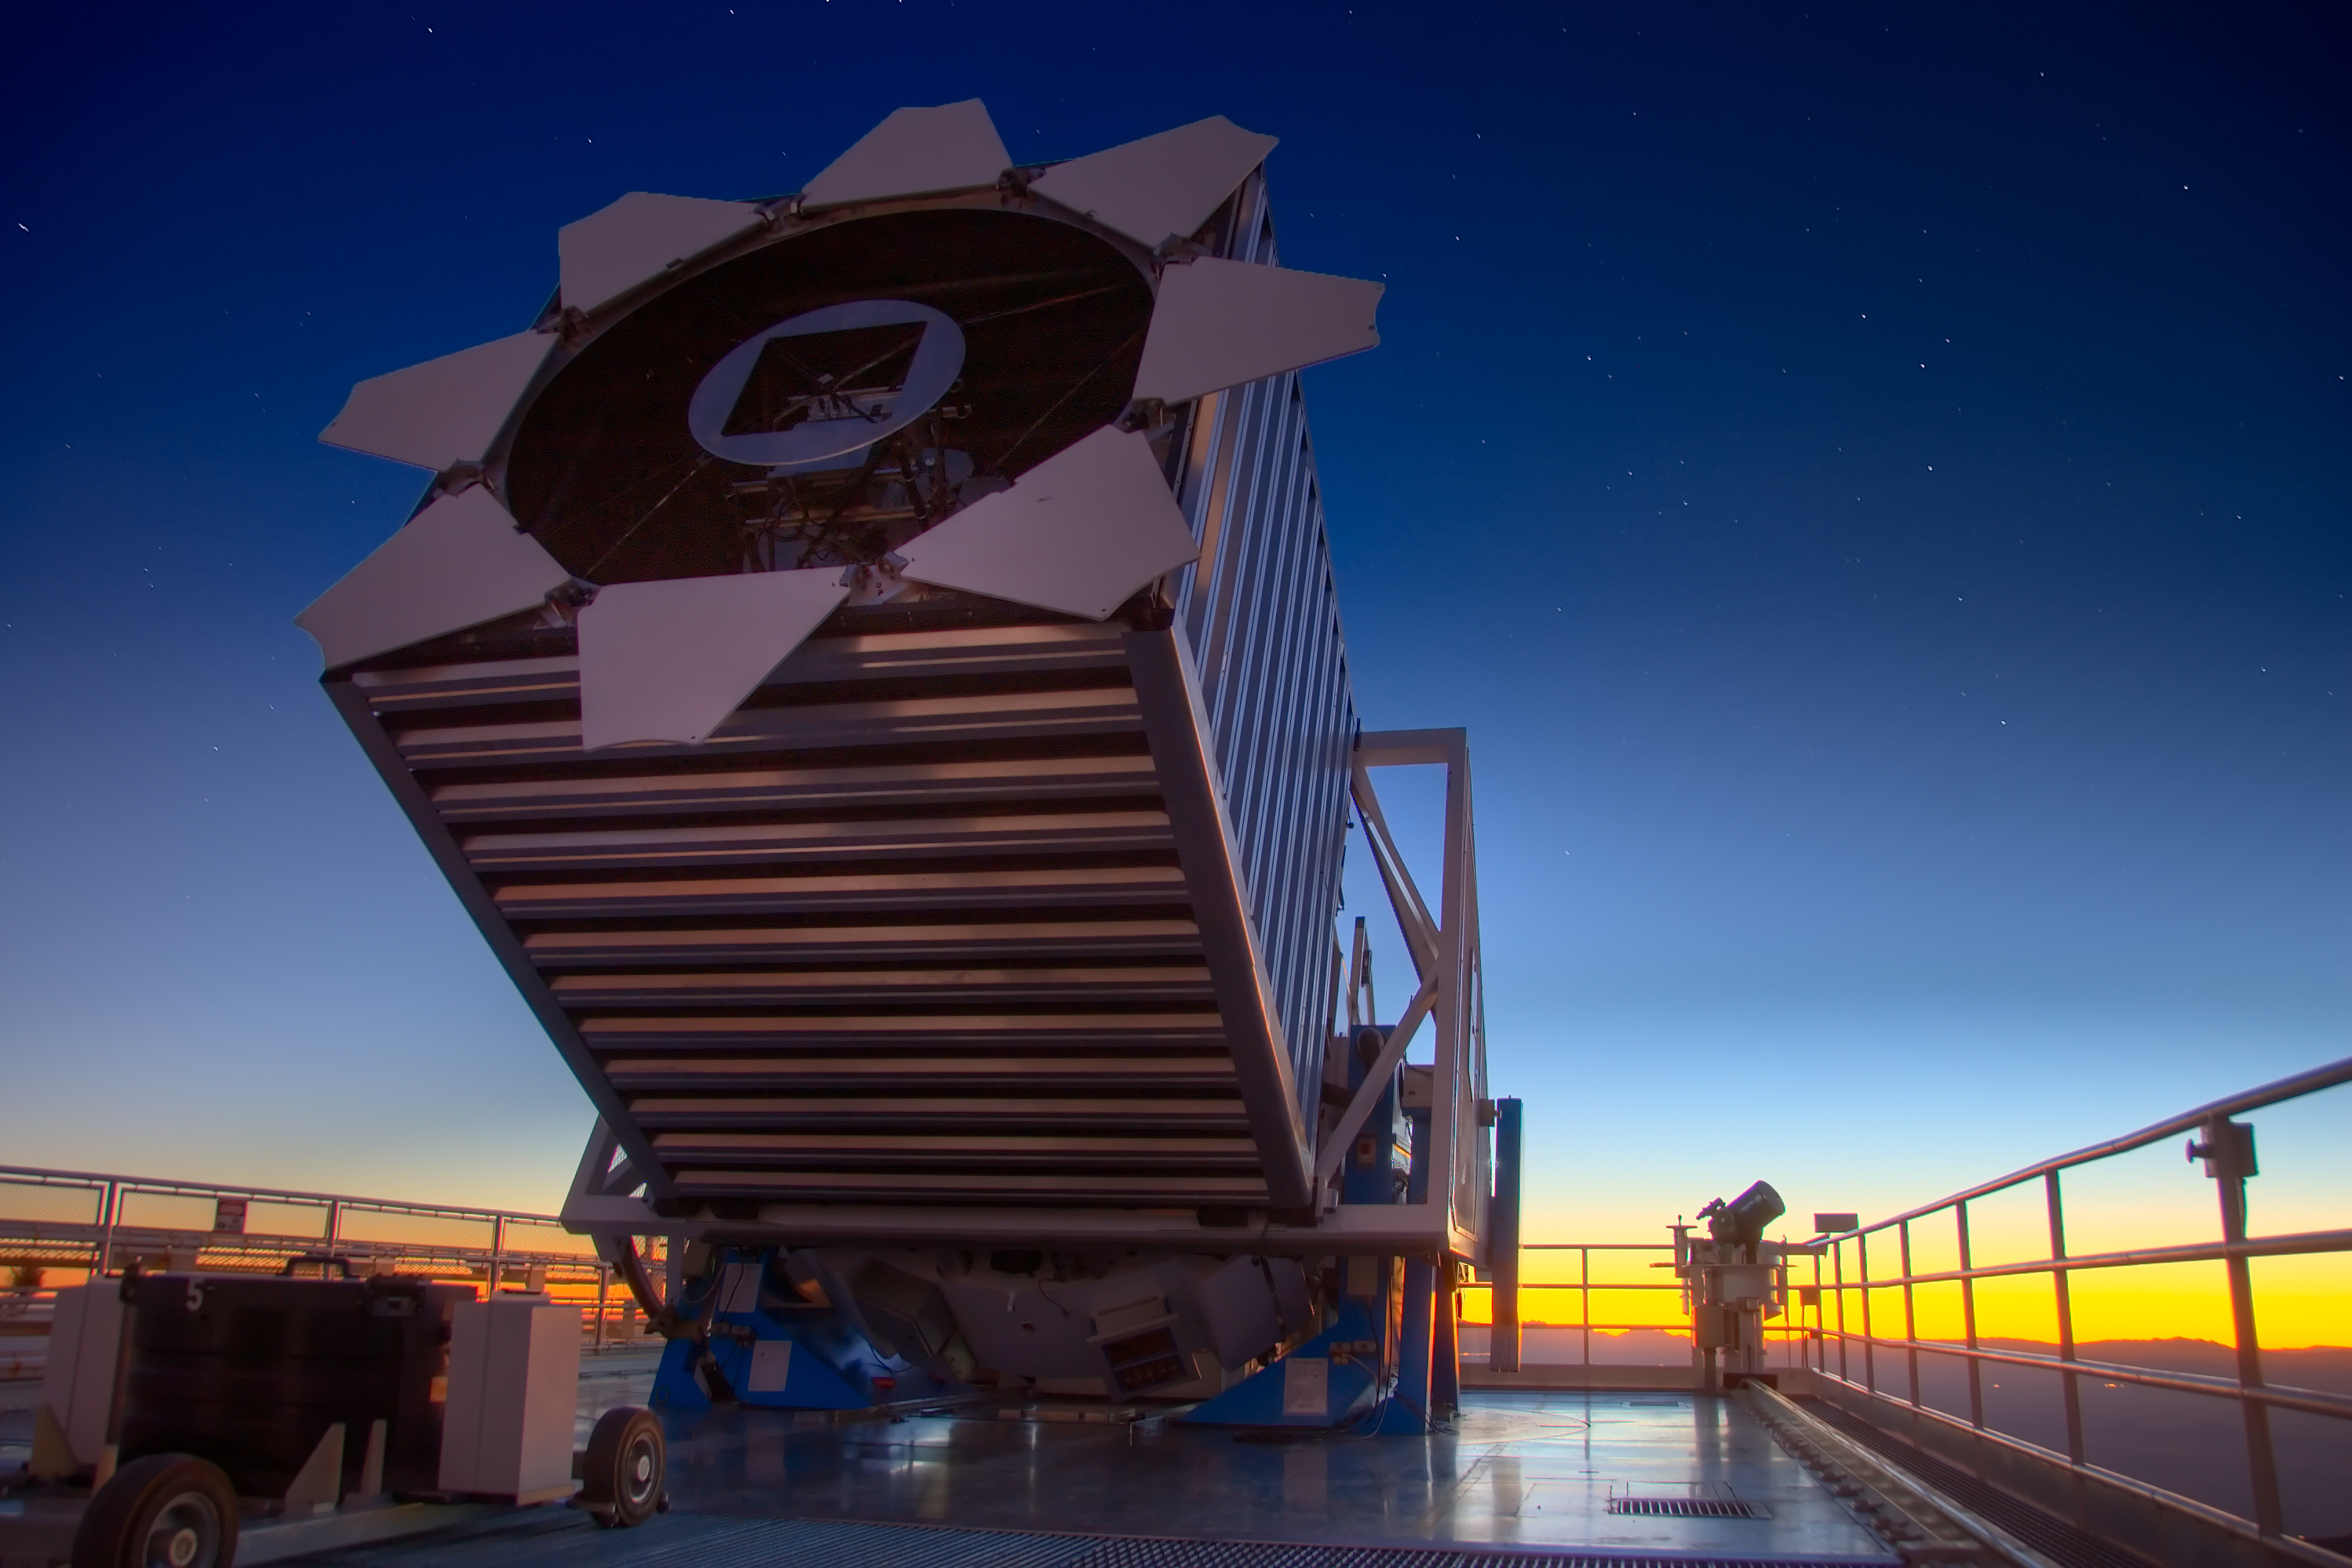
The Sloan Digital Sky Survey (SDSS) is a multi-spectral imaging and spectroscopic redshift survey, using a 2.5-meter optical telescope located in New Mexico (United States). One of the programs that constitute the SDSS is the Extended Baryon Oscillation Spectroscopic Survey (eBOSS), in which more than one hundred astrophysicists participate.
Our postdoctoral researcher Héctor Gil-Marín has led the analysis of these galaxy maps by measuring the rate of expansion and growth of the Universe’s structures from 6 billion years ago. These measurements help to put together what was already known about the initial physics of the Universe with what was known about its most recent history, allowing us to generate a complete picture of the expansion of the Universe over time.
Researchers have used massive, red galaxies to obtain the part of the map dated to 6 billion years ago. For farther distances, they have used younger blue galaxies. Finally, they have used quasars — bright galaxies that light up as a consequence of matter absorbed by a supermassive black hole at their core — to obtain the map of the Universe from 11 billion years ago and earlier. To reveal the patterns of the Universe, a very careful analysis of each measurement has been made, to eliminate possible contaminants.
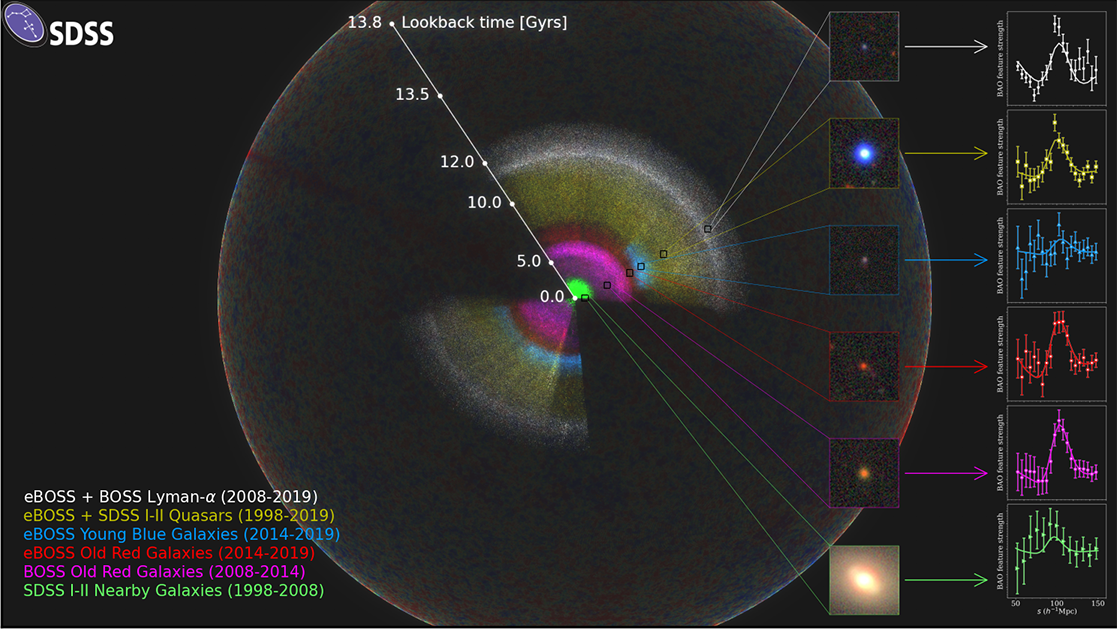
The resulting map reveals filaments and gaps that define the structure of the Universe from the time it was only about 300,000 years old. Using this map, the researchers searched for patterns in the distribution of galaxies, which provide information about various key parameters of our Universe (the signals of these patterns are shown in the boxes of the image).
The SDSS map is shown as a rainbow of colours, located within the observable Universe (the outer sphere, which shows fluctuations in the cosmic microwave background). We are located in the centre of this map. A box for each color-coded section of the map includes the image of a typical galaxy or quasar, and also the signal being. As we look farther, we look back in time. Therefore, the location of these signals reveals the expansion rate of the Universe at different times in cosmic history.
Measuring the Universe's expansion
Santiago Ávila is a researcher at the Autonomous University of Madrid (UAM), explains "We have measured the statistical properties of these galaxy maps and have deduced the rate at which the Universe expands over time". Ávila has developed new methods for computer simulation of galaxy maps, such as those observed in this study. "In combination with additional data from the cosmic microwave background and supernova observations, we have deduced that the geometric curvature of the Universe is, in fact, flat. We have also measured the local expansion rate, with an accuracy of better than 1%."
The cosmic history revealed by the map shows that the expansion of the Universe began to accelerate about 6,000 million years ago, and that it has continued to and has continued to get faster and faster ever since. Combining observations from eBOSS with studies of the Universe in its infancy reveals cracks in this picture of the Universe. In particular, the researcher’s measurements of the current rate of expansion of the Universe (the “Hubble Constant”) is about 10% lower than the value found from distances to nearby galaxies. "The high precision of the data makes it highly unlikely that this mismatch is due to chance", explains Andreu Font Ribera, a researcher at the High Energy Physics Institute (IFAE).
This accelerated expansion could be due to a mysterious invisible component of the Universe called dark energy. There is no widely accepted explanation for this discrepancy in expansion rate measurements, and although the existence of dark energy is consistent with Einstein's general theory of relativity, it is extremely difficult to reconcile with our current knowledge of particle physics. An exciting possibility is that a previously unknown form of matter or energy from the early Universe might have left a trace on our history.
{"preview_thumbnail":"/sites/serviastro/files/styles/video_embed_wysiwyg_preview/public/video_thumbnails/TKiYOnsE8Y4.jpg?itok=tnYhUoSV","video_url":"https://youtu.be/TKiYOnsE8Y4","settings":{"responsive":1,"width":"854","height":"480","autoplay":0},"settings_summary":["Embedded Video (Responsive)."]}
On the next generation of telescopes
Following the SDSS path, work is already underway on the next generation of telescopes that will take over from eBOSS. It will start at the end of the year with the Dark Energy Spectroscopic Instrument (DESI), which will observe ten times more galaxies and quasars than eBOSS, thanks to a new instrument located at the Kitt Peak National Observatory (Arizona, United States). At the same time, the European Space Agency plans for 2022 the take-off of the Euclid satellite, equipped with a unique telescope that will provide a complementary view of the Universe. These instruments, both with Spanish participation, will provide data with a precision never seen before, a fact that will allow us to solve the enigma of dark energy and the discordance between the expansion rate of the local and primitive Universe. Or perhaps, they will reveal more surprises.
More information
Press release of the Institute of Cosmos Sciences
International press release
What is the Hubble constant?
The Hubble constant indicates the rate of expansion of the Universe, and despite being a "constant", its a value that evolves. The value of the constant at the time of observation is called H0. The Hubble constant is a key number in astronomy since it is used to calculate the size and age of the Universe. Also known as the Hubble parameter, it is the proportionality constant that appears in the mathematical form of the Hubble-Lemaître law, a physical law that states that the farther one galaxy is from another, the faster they appear to move away.
The measurement of the Hubble constant is one of the great challenges of astronomy, and has been the subject of debate and controversy. The value of the Hubble constant is estimated by measuring the redshift of distant galaxies and then determining the distances to them by some other method than Hubble's law. In the second half of the 20th century, the value of H0 was estimated between 50 and 90 (km / s) / Mpc. The Hubble Space Telescope gave the most accurate optical resolution in May 2001 with its final estimate of 72 ± 8 (km / s) / Mpc, but in 2018, measurements by researcher A. Reiss and colleagues disagreed by almost 9% regarding to the values obtained previously. This discrepancy between the current values is what in current cosmology is called the "Hubble tension".


