Gaia mission releases map of more than a billion stars – here’s what it can teach us
Most of us have looked up at the night sky and wondered how far away the stars are or in what direction they are moving. The truth is, scientists don’t know the exact positions or velocities of the vast majority of the stars in the Milky Way. But now a new tranche of data from the European Space Agency’s Gaia satellite, aiming to map stars in our galaxy in unprecedented detail, has come in to shed light on the issue.
The Gaia Archive opened on April 25, making public Gaia’s second data release to everyone. To quote the character Dave Bowman in the sci-fi classic 2001: A Space Odyssey: “It’s full of stars”. In fact, it contains data on the distances to more than 1.3 billion stars.
The Gaia satellite was launched in 2013 and has been scanning the sky with its two telescopes continuously ever since, with the aim of deciphering how our Milky Way galaxy formed and evolved. To do this, it is measuring something called parallax. If you hold a finger at arms length and look at it with one eye and then the other, your finger appears to shift position compared to the background. The angular change is called parallax.
Being in space allows Gaia to see similar tiny shifts in star positions. Observations at different locations six months apart (half way of its orbit around the sun) are akin to looking at your finger with one eye and then the other. When you know the parallax as well as the distance from Gaia to the sun (or the distance from your nose to your eye), you can use simple trigonometry to work out the distance to each star (or your finger).
Gaia also sees stars move in the plane of the sky over time. These units of “angle per time” can be converted to a physical unit of speed (for example kilometres per second) if we know the distance to the stars. However, to know how a star is moving in three dimensions in space requires that we also measure the speed perpendicular to the sky along the line-of-sight. This requires a galactic speed camera!
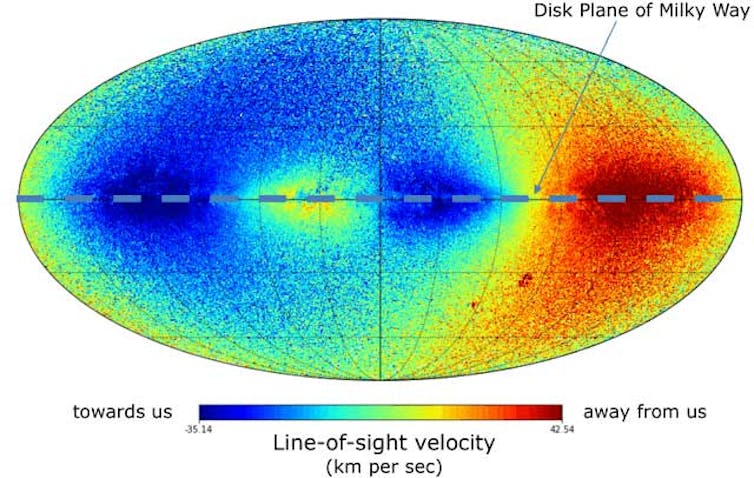
A normal radar speed camera uses the Doppler effect – the stretching or squashing of waves because of motion – by measuring the change in the radio frequency from signals bounced off cars to measure their speed. Similarly, Gaia measures the change in frequency in the light from stars to check their speed. The star light is bluer if the star is moving towards us or redder if the star is moving away from us. This is called radial velocity.
Revolutionising data
Gaia’s first data release in 2016 published the distances of around two million stars but did not include any radial velocities. However we already knew the radial velocity of less than 400,000 of these stars – measured from the ground by many different surveys.
Gaia’s second data release includes information on sky positions and brightness for nearly 1.7 billion stars and more than seven million radial velocities. Not only does this make Gaia the largest radial velocity survey ever – it increases the number of stars with accurate 3D space velocities by a factor of 18.
A series of Gaia science demonstration papers have also been published alongside the star catalogue. I was involved in the research behind one of these papers, constructing the most detailed map ever of 3D space velocities to date.
Excitingly, the map revealed that there’s a global arrangement of stars in the Milky Way, most of which reside in our galaxy’s thin disc. These are organised in thin substructures with the shape of circular arches. This is a vital clue to how the Milky Way formed and how it is still evolving. The baton now passes to the astronomical community to interpret this finding and explore the full potential of Gaia’s second data release.
Eventually, the catalogue produced by Gaia could help us make many new discoveries – including mapping tens of thousands of asteroids in our solar system. By looking at dips in the stars’ brightness, we could also find exoplanets orbiting stars other than our own.
Perhaps more surprising, the measurements could even help us predict exactly where dark matter – an unknown, invisible substance thought to make up most of the matter in the universe – resides in the galaxy. Gaia has also found nearly 5,000 objects that can be followed by ground-based telescopes before they disappear. Most of these are supernovas, exploding stars, which may help to reveal the nature of dark energy that is causing the expansion of the universe to accelerate.
The next data release by Gaia will be in 2020. This is expected to boost the numbers of stars with known radial velocities from seven million today to around 30m – keeping our team busy for several years yet.
