
Gaia has proven to be a powerful tool providing very precise astrometry and photometry in the first releases of the mission (see Gaia DR2 and Gaia DR1). The third release and beyond (find here the current release scenario planning) will include some calibrated spectrophotometric data.
Spectrophotometry in Gaia is obtained using two prisms. Each of these prisms is able to divide the incoming light of the observed source into the different colours of the rainbow (similarly to what is represented in the iconic image of the cover of the Pink Floyd’s album “The dark side of the Moon”). One of these prisms is designed to detect blue light, called Blue Photometer or BP, covering a wavelength range from 330 to 680 nm. The second prism is, instead, designed for redder light, called Red Photometer or RP, covering the wavelength range from 640 to 1100 nm.
When the final Gaia catalogue will be available, it will constitute the most complete and homogeneous spectrophotometric catalogue of sources, containing more than one billion objects with homogeneous spectra obtained with the same instrument all across the sky.
This large catalogue of spectrophotometric data will be very useful to extract the astrophysical information for each source. In the case of stars, the BP and RP spectra provide temperatures, surface gravity, chemical composition and interstellar absorption. For galaxies and quasars, BP and RP spectra allow deriving the redshift. For asteroids one can determine their composition and types.
Right after the launch of the Gaia space telescope, and before starting the scientific operations, several tests were performed to assure the health of the payload. At that time, some raw observations obtained with the BP and RP spectrophotometers were published (see this image of the week of June 2014). Those spectra were uncalibrated single observations. Since then, we have accumulated observations in BP and RP for each source in the sky.
Before its publication in the Gaia catalogue, the team in charge of the photometric calibration in Gaia (Coordination Unit 5 or CU5) has calibrated the two spectrophotometers and combined the different observations of the same source to build a mean spectrum representing the average of all transits. These mean spectra will suffer less noise effects than every individual observation, providing more information than a single transit. The figures included here show some examples of these mean calibrated spectra derived by CU5.
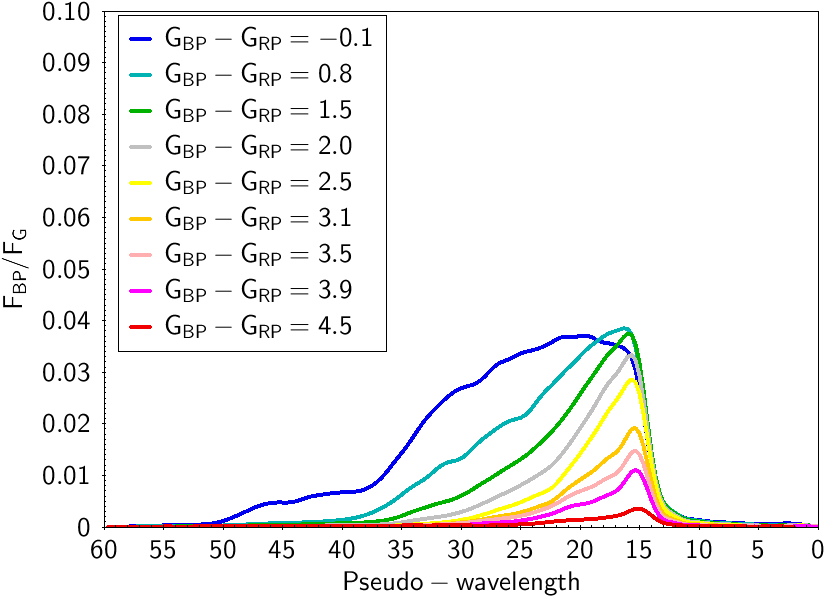
In the absence of extinction, the colour of the stars is related with their temperature. Hot stars are bluer than cooler ones. Thus, hot stars have most of their flux in the BP instrument and cooler ones, instead, are brighter in RP. This is a gradual effect and intermediate temperatures will have a more balanced contribution in both wavelength ranges. This can be clearly seen in Figure 1, showing selected examples of the first calibrated mean BP and RP spectra for stars having different observed colours.
By integrating the spectra, one can derive two associated magnitudes, one for the BP and one for the RP instrument. We call these two magnitudes GBP and GRP, respectively. Taking the difference between these two magnitudes gives an indication of how blue or red a source is. Blue (hotter) stars have smaller GBP - GRP values than red (cooler) stars. In Gaia, there is also a third (and more precise) magnitude, obtained with the astrometric detectors in white light devoted to the astrometric measurements, called G, which provides a better estimate of the global apparent brightness of the star. The mean spectra in Figure 1 have been normalised by the total flux in G. The GBP - GRP colour of all sources is also given in the legend of the plot.
The abscissa in all plots is given in pseudo-wavelength. This is an internal wavelength scale, close to the actual sampling of the spectra, representing different absolute wavelenghts in BP and RP. Conversion to the absolute wavelength physical units will be provided with the released spectra (expected in Gaia DR3).
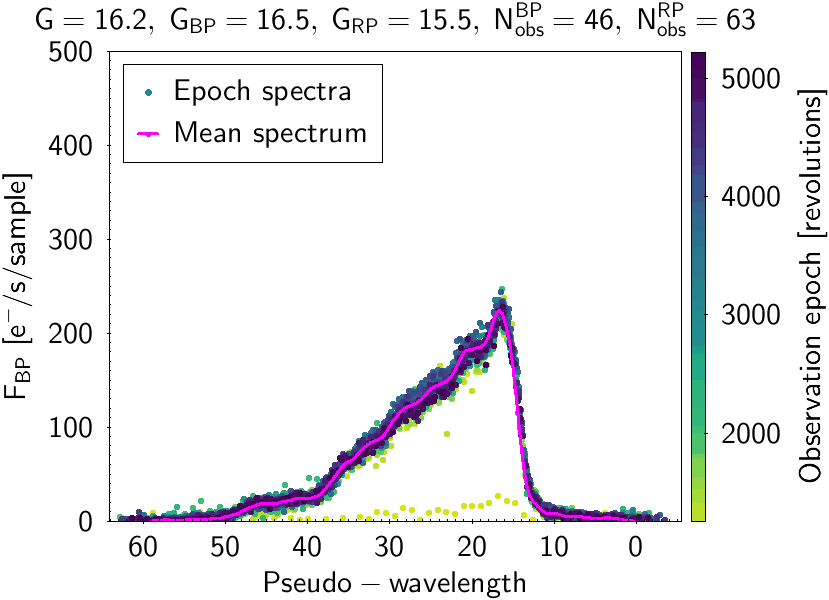
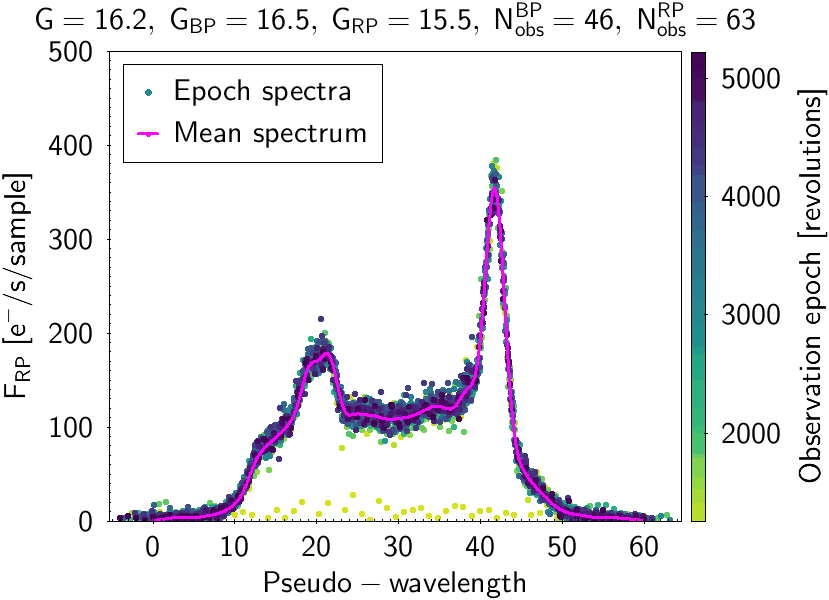
Figure 2. Epoch and mean spectra for an extragalactic source used in Gaia DR2 to derive the Gaia Celestial Reference Frame (Gaia-CRF). The titles in each plot include the magnitudes in the astrometric field (G) and each spectrophotometric instrument (GBP and GRP) and also the number of individual observations in each instrument Nobs. Image credit: ESA/Gaia/DPAC.
Sources in Figure 1 have a magnitude of about G=13 mag. The signal to noise ratio observed at the maximum flux of the spectra at this magnitude is about 600 for BP and 1000 for RP.
Gaia also observes point-like sources other than stars. For example, extragalactic sources (far-away quasars) are used to establish the astrometric reference frame (Gaia Celestial Reference Frame, Gaia-CRF). For those sources, the spectral energy distribution in BP and RP differs drastically from those of stellar sources. Some of these quasars can have strong emission lines. Two of these type of sources are plotted in Figures 2 and 3.
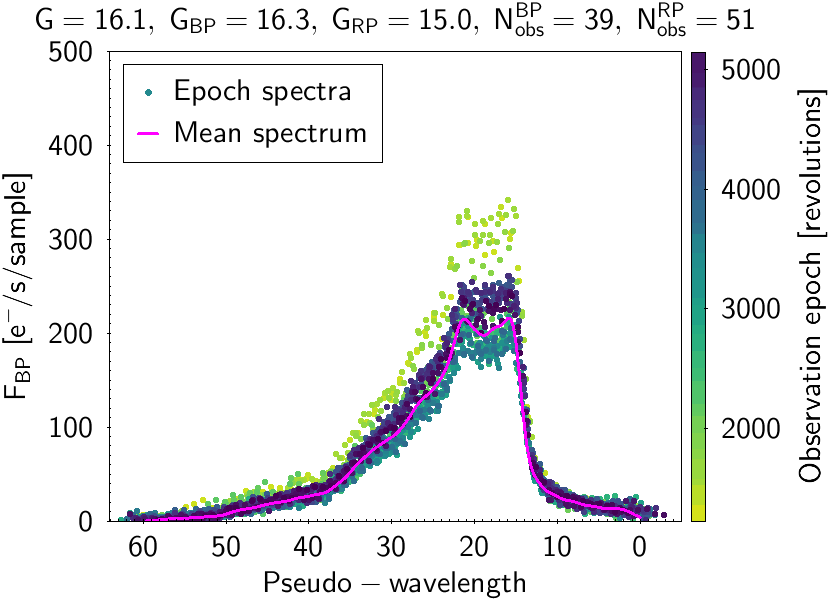
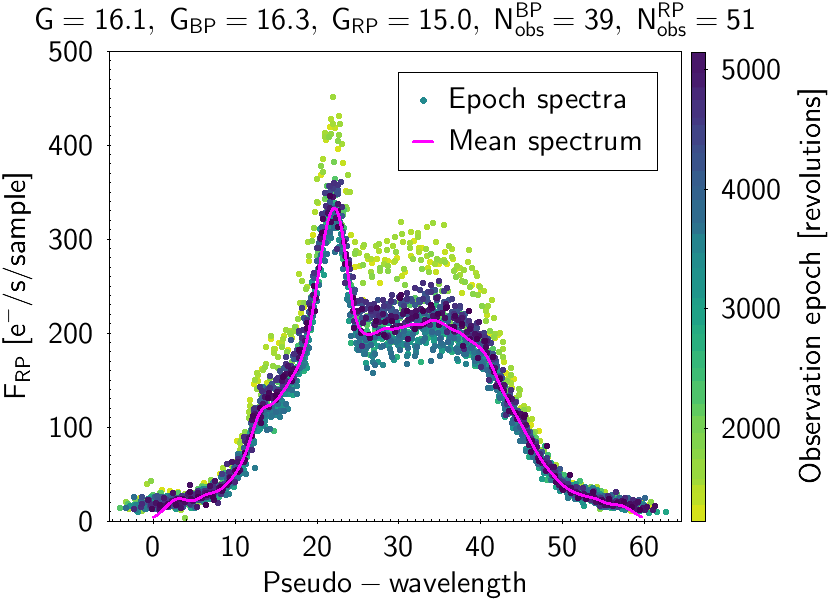
Figure 3. The same as in Figure 2 but for another quasar. The flux-level variations between observations made at different epochs indicate the variable nature of the source. Image credit: ESA/Gaia/DPAC.
These plots show both mean and epoch spectra overplotted, illustrating the process to build the mean spectra from different epoch observations. The different epochs in Gaia are measured in number of six-hour revolutions done by the satellite while surveying the sky. The source in Figure 2 has a very low flux level in one of its transits. The photometric processing is sufficiently robust to consider this measurement as an outlier, thereby not producing a deviating mean spectrum by including this bad observation. The source plotted in Figure 3 is a variable one showing a changing flux level at different epochs. The mean spectrum built is a weighted average of all the epoch observations. For variable sources, this means that although the mean spectra may not be representative of any particular epoch, they are useful to provide a hint of the average behaviour and mean characteristics of the source.
Credits: ESA/Gaia/DPAC, Coordination Unit 5, Josep Manel Carrasco, Francesca De Angeli, Dafydd Wyn Evans, Carme Jordi, Michael Weiler


